
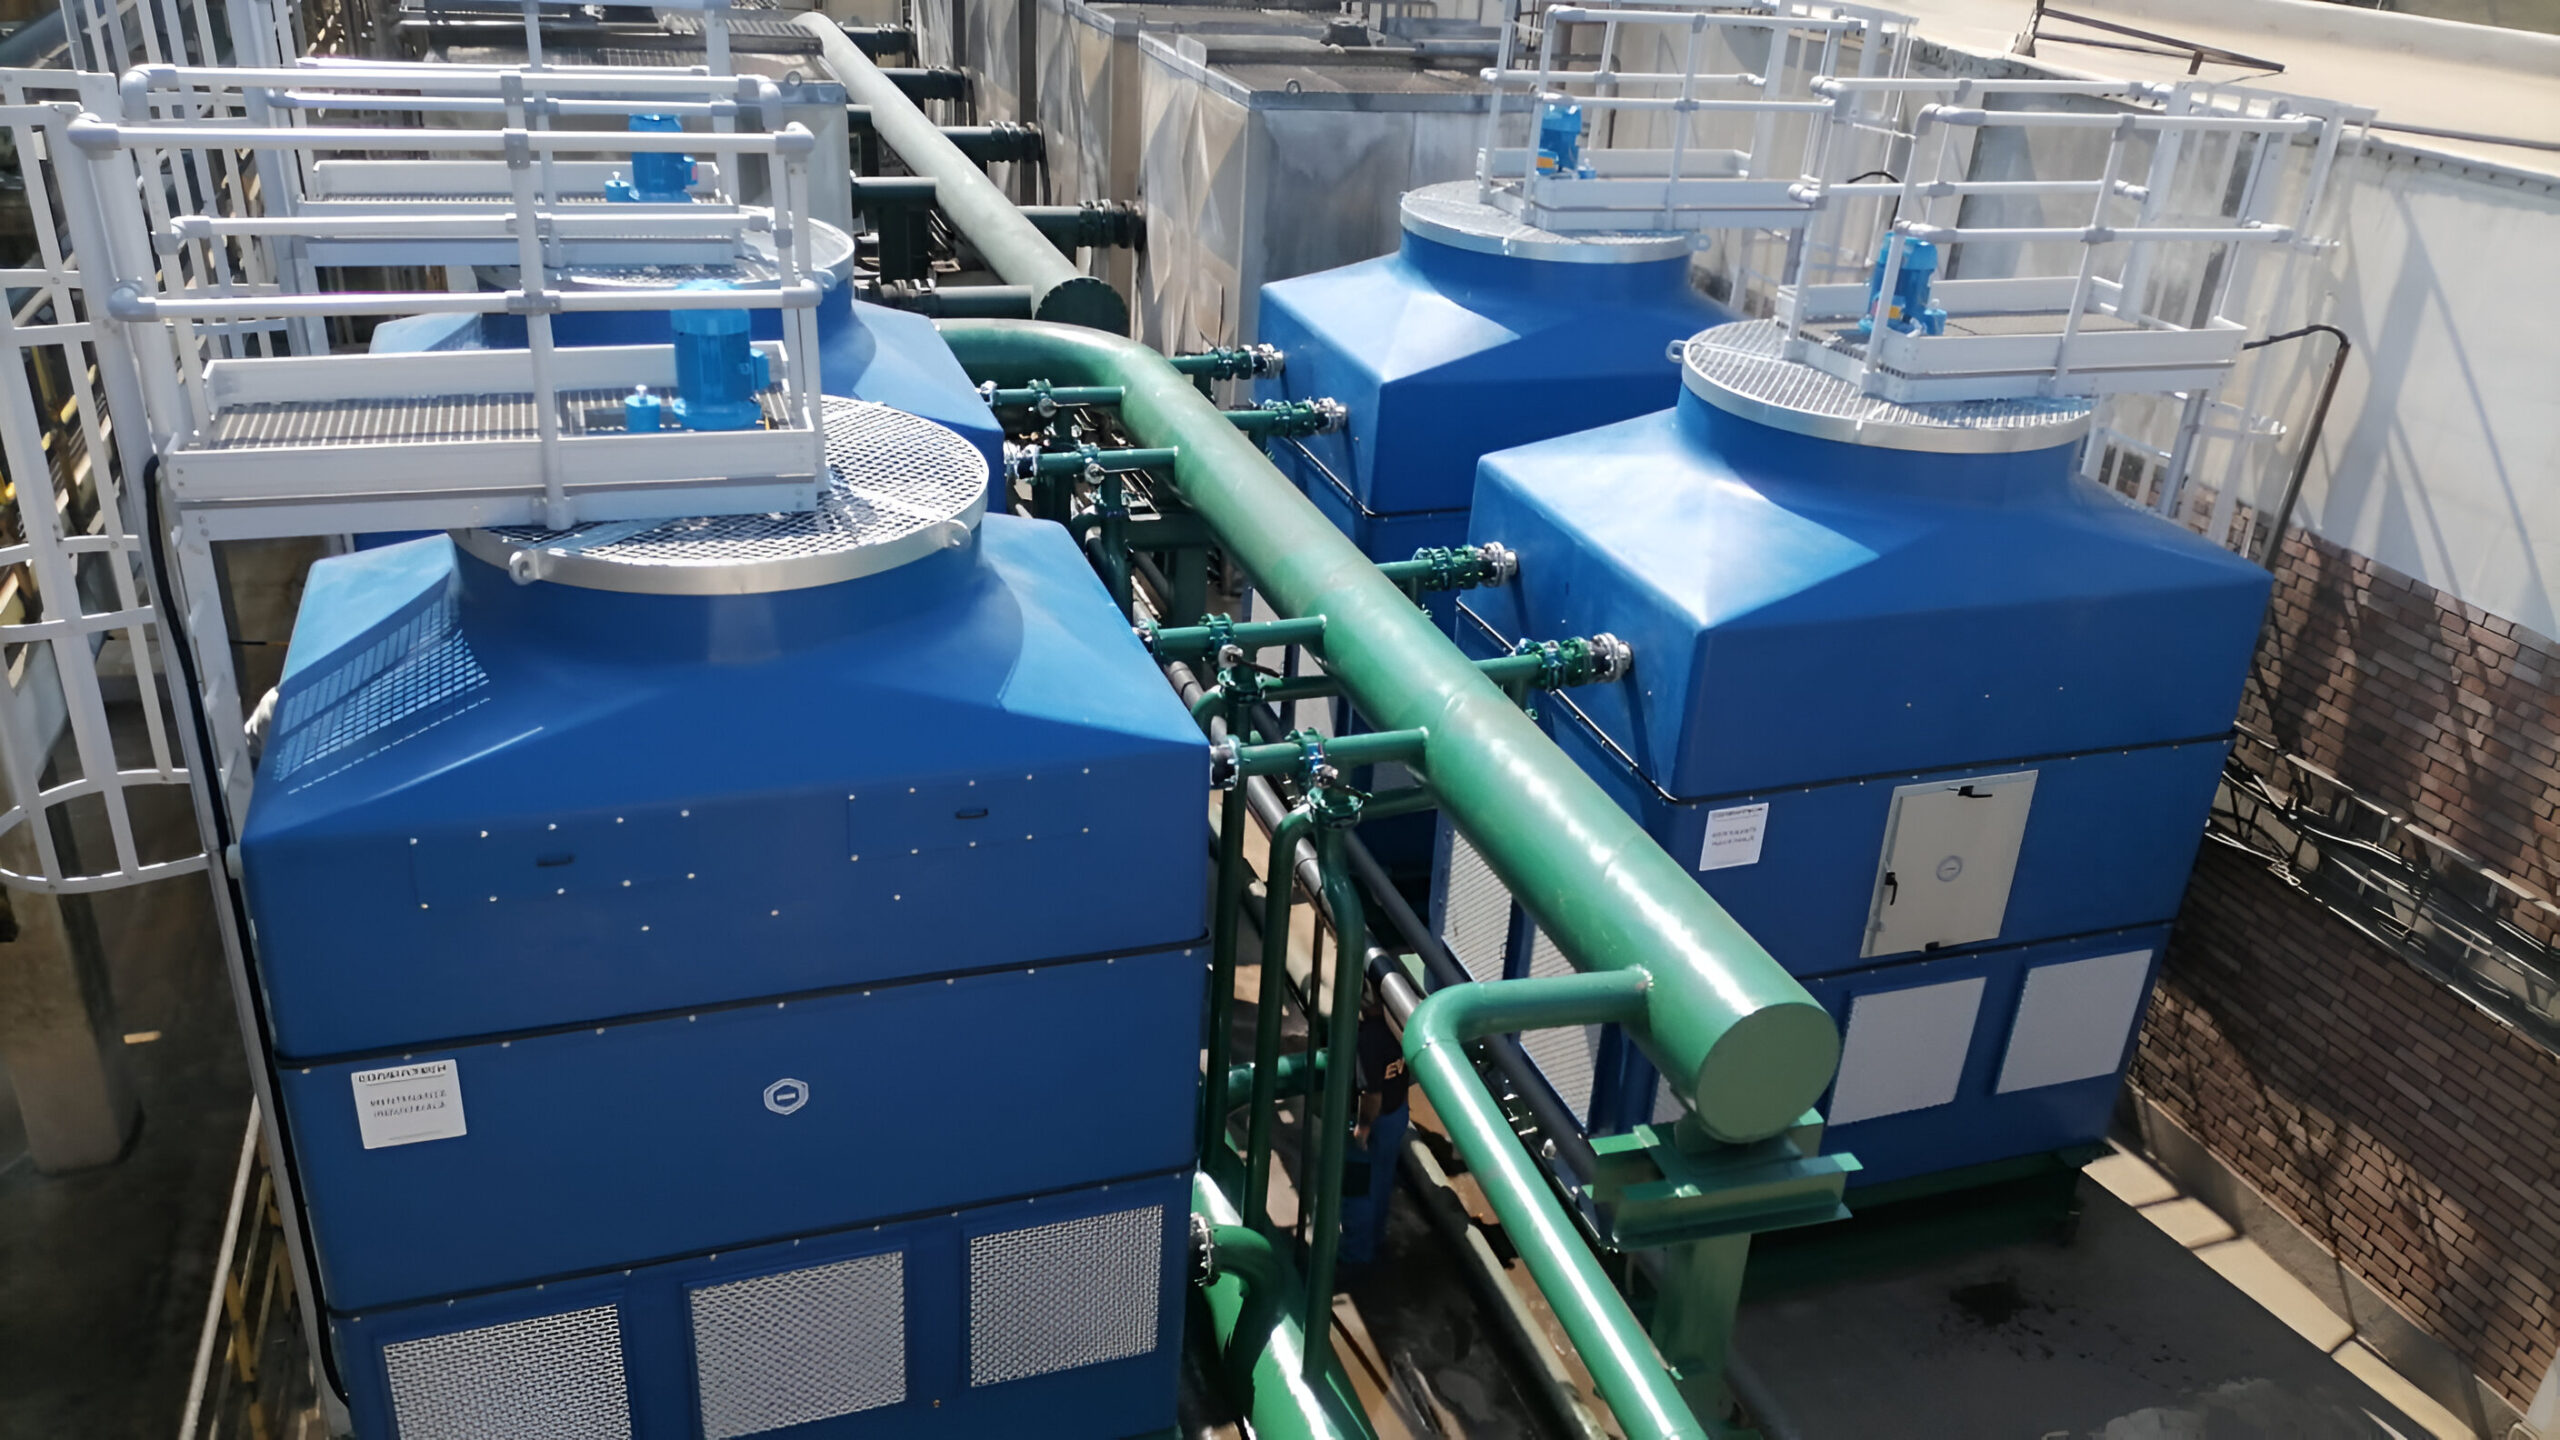
Most cooling towers on established UK manufacturing sites do not fail. They just get slowly worse, in ways nobody notices. The tower keeps running, the alarms stay quiet and production carries on. Meanwhile the chillers, compressors and process equipment downstream work harder every year, the water bill climbs and maintenance costs creep up. None of it shows up as a single event, so it rarely gets investigated.
Cooling tower performance optimisation on an existing site does not start with new equipment. It starts with finding where the tower is already losing performance. In our experience, three areas account for most hidden losses in industrial cooling systems: approach temperature drift, poor cycles of concentration and inefficient fan control. This guide explains how to diagnose each one.
How do you spot approach temperature drift in a cooling tower?
Approach is the difference between the cold water leaving the tower and the ambient wet bulb temperature. It is the clearest single indicator of how well a tower is rejecting heat, and it is the one most sites do not trend.
A tower designed for a 4°C approach that now runs at 7°C returns warmer water to the process. On chilled water systems, every 1°C rise in condenser water temperature typically adds roughly 2% to 3% to chiller energy consumption. On process cooling, it can mean slower cycle times, reduced throughput or product drifting out of specification during summer peaks.

Common causes of approach drift
- Fouled or scaled fill, reducing wetted surface area and restricting airflow
- Blocked or missing distribution nozzles, leaving dry patches across the fill
- Damaged or displaced drift eliminators disrupting airflow
- Recirculation of warm, moist discharge air back into the air inlet, often after nearby site changes
- Water flow rates outside the design range, either too high or too low
How to check
Record hot water temperature, cold water temperature and local wet bulb at the same time, at comparable loads, and compare the results against the original design data sheet. A single reading tells you little. A trend across a season tells you a great deal. Follow up with an internal inspection: uneven water distribution and fill condition can usually be identified on a basic walk-down.
Are poor cycles of concentration costing you water and chemicals?
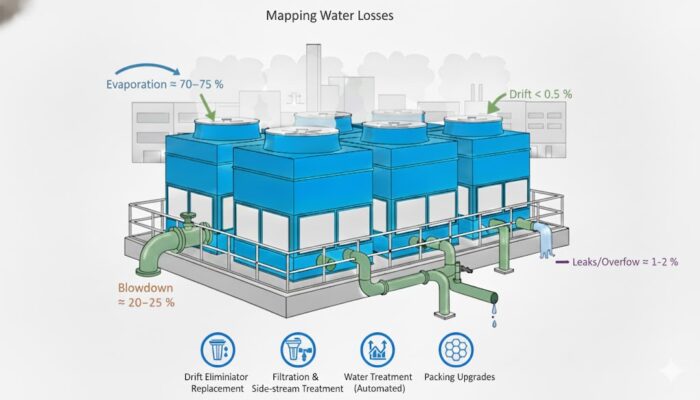
Cycles of concentration compare the dissolved solids in the circulating water with those in the makeup water. Run too few cycles and you are paying to send treated water to drain. Run too many without the right treatment programme and you get scale, corrosion and fouling, which feeds directly back into approach drift.
The water balance is easy to underestimate. Blowdown is approximately evaporation divided by (cycles minus one). Moving from 3 cycles to 6 reduces blowdown by around 60% and makeup by about 20%, with matching savings on water, effluent and chemical costs.
Warning signs
- Conductivity controllers out of calibration or left in manual
- Blowdown valves passing or stuck open
- Makeup and blowdown meters missing or never read
- A treatment programme designed years ago for a different water supply or heat load
- Visible scale on fill, basin or heat exchanger surfaces
How to check
Measure conductivity in the makeup and circulating water to calculate actual cycles, then compare that figure against your treatment specification. Where meters are fitted, reconcile makeup against blowdown and estimated evaporation. A significant gap usually points to leaks, overflow or excessive drift loss.
On UK sites, any change to cycles of concentration must remain aligned with your Legionella risk assessment and HSG274 Part 2. Increasing cycles is a water treatment and control decision, not simply a valve adjustment.
Is your cooling tower fan control wasting energy?
Fan energy is where small control issues become large running costs. Under the fan affinity laws, power varies with the cube of speed, so a fan running at 80% speed draws roughly half the power of one running at full speed.
Many existing towers still operate fans on simple on/off or two-speed control, or have variable speed drives fitted but configured to behave like fixed-speed starters.
Typical fan control issues
- Fans running at 100% all year regardless of wet bulb or heat load
- Cold water setpoints fixed for summer design conditions and never relaxed
- Multi-cell towers staging fans one at a time rather than running all cells at reduced speed
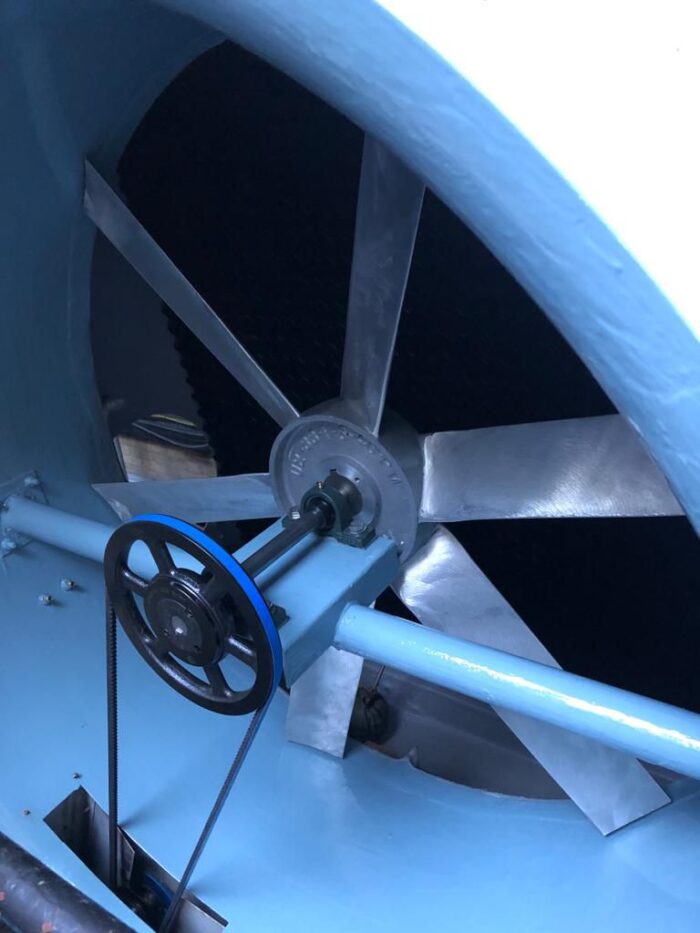
- Worn belts, misaligned drives or incorrect blade pitch reducing airflow per kW
- VSDs bypassed after a fault and never returned to automatic
How to check
Trend fan speed or motor current against wet bulb and heat load over several weeks. If the fans look the same on a cool spring night as on a hot July afternoon, there is almost certainly a saving available. Check blade pitch, belt tension and gearbox condition at the same time.
Where should you start with cooling tower performance optimisation?
You do not need a large survey to establish whether these losses exist on your site. A simple first pass looks like this:
- Pull the original design data: flow, range, approach and design wet bulb.
- Take a set of matched temperature readings and calculate the current approach.
- Measure makeup and circulating conductivity to confirm actual cycles.
- Review fan control logic and trend fan speed against conditions.
- Carry out a visual inspection of distribution, fill, eliminators and basin.
Comparing those five checks against the design intent usually shows where the tower is losing performance, and whether the fix is a maintenance task, a control change or a component upgrade. Once the losses are identified, our guide to practical fixes for cooling tower performance covers the remedies that restore design performance without full replacement.
What does recovering design performance deliver?
On existing manufacturing sites, the most cost-effective heat rejection improvement often comes from recovering design performance rather than adding capacity. Better approach, better water management and smarter fan control together mean lower energy and water costs, more summer headroom and a longer working life for the tower.
This is exactly what a Vistech Efficiency Review is designed to do. It is a structured assessment of how your tower is performing against its design, where the losses are, and which fixes will pay back fastest. We only recommend progression where measurable opportunity exists, and we guarantee it. If no efficiency improvement is identified, the assessment cost is refunded.
If your tower has always run a bit warm in summer, it is probably worth a closer look. For UK manufacturing sites with cooling loads above 500kW, that conversation starts with a single site visit. Contact the Vistech team to arrange yours.